Getting Started with Portfolio Management – The Project List
Project portfolio management is a senior leadership discipline to accomplish strategic goals and maximize business value through its project investments. It’s about doing the right work. A portfolio is a collection of projects and programs. Therefore, if you want to manage the portfolio, you need to know what is in the portfolio. Hence, the most fundamental task in portfolio management is to create a project list. The first step in starting project portfolio management at your company is to inventory all of the project work going on. You cannot manage what you cannot see, and that’s why you need a strong project list to manage the portfolio as it will become your single source of truth. A good project list is an important tool for managing the project portfolio as it contains fundamental information about all of your active, pending, completed, cancelled or postponed projects.
Why the Project List is Important
The project list is actually far more valuable than you realize. It’s not glamorous, but if you get it right, it will be a treasure trove of strategic information for years to come (don’t miss the analytics section below). If you get it wrong, it simply becomes a list of project data. Some of the benefits of setting up a good project list include:
- It tells you what projects you are doing right now
- It is the single source of truth for project and portfolio data
- It can produce project and portfolio reports and analytics
- It aids portfolio communication and facilitates discussion among teams and departments
- It is a repository for all completed, cancelled, and on hold projects
- It is part of the project and portfolio governance infrastructure
- It will help you identify duplicitive projects and even project interdependencies
Important Project Information to Be Collected
A good project list need to collect and compile the right information. While some organizations start with lean data and develop over time, there are key pieces of information that are easy to collect enough information from the beginning and grow from there. The list below includes recommendations of common project information that should be collected:
- Project Title: projects need a short name by which they are called. This could be a code name or other short title to specify what the project is about. Some companies like to use project ID numbers in addition to a project title in support of tracking projects in multiple systems like Salesforce. At one aerospace company, a verb was included in the title (e.g. “retire”, “implement”, “develop”, etc.) to quick explain what the project was doing.
- Project Description: a relatively short description of the project is very useful, especially for people who are not familiar with the project.
- Project State: the project state refers to the current condition of the project – active, on hold, completed, cancelled, or pending. This is very important so that the organization has alignment and clarity on the current condition of every project in the portfolio.
- Current Phase: for reporting and tracking purposes it is important to know which phase in the project lifecycle a specific project is in.
- Project Health: a simple “red”, “yellow”, “green” performance indicators will highlight when projects are in trouble or need help.
- Project Manager: necessary for knowing the primary point of contact for communication purposes.
- Project Sponsor: necessary for knowing the leadership point of contact for communication purposes.
- Sponsoring Department: capturing the sponsoring department is useful for portfolio reporting purposes to understand how much of the project portfolio is directed toward certain departments.
- Project Category: there are multiple ways of categorizing projects, but the bottom line is that you need to categorize your projects in a way that is meaningful to your organization. Gartner’s “run”, “grow”, “transform” paradigm is useful for analyzing how much of your portfolio budget is spent on various types of projects. If you don’t have good categorical information, you’re not effectively analyzing your portfolio.
- Strategic Alignment: effective portfolio management aligns projects to strategic goals. At a minimum, each project should be aligned to one primary strategic goal. As part of your prioritization scoring criteria, you may also choose to measure the strength of alignment as well.
- Start/Finish Dates: be sure to capture the actual start and finish dates of every project. This can then be used to calculate total duration of projects which can then be used for analysis purposes. Some organizations also want to track baseline start and finish dates for variance analysis purposes.
- Gate Approval Dates: if your organization has a Phase-Gate process, you must capture the approval dates at each gate. On one hand, this is just good portfolio hygiene, but later on, this information can be invaluable for improving your Phase-Gate process.
- Funding Status: if your organization tracks whether projects are funded or unfunded, this can be useful for reporting purposes, especially if you include a number of pending projects on your list.
- Project Costs: not all organizations track project costs, but when you do, it will greatly enhance portfolio reporting. This is one of the most important pieces of information to collect; it will unlock new insights in your portfolio reports and analytics.
- Resource effort: even getting rough order of magnitude estimates of resource effort for a specific bottleneck resource could prove to be invaluable down the road.
- Financial Benefits: few organizations track financial benefits of a project, but the sooner you do, the sooner your reporting and analytic quality will take another significant jump.
- Priority/Prioritization Score: if your organization has a prioritization process, I recommend tracking the various scores so that it can used for analysis and other reports such as a risk-value bubble chart.
Your project list is a treasure trove waiting to be mined, but you could be missing out if your data is stuck in spreadsheets
VIDEO: Status Reports Made Easy
Portfolio Reports Generated by the Project List
Having covered the minimum data that most organizations should be capturing in their project list, let’s discuss how the information can be used to enhance your portfolio management process. The reports and analytics can answer fundamental portfolio management questions such as: What are we working on? Where are we investing money and people? How are we performing? Is our portfolio optimized? The key is to make use of the data you collect. Remember, any data collected but not used is a drain of organizational resources.
Many of your basic portfolio reports will be generated from the information in your project list. With this information you will be able to develop a number of reports that provide portfolio insights.
- How much of the portfolio budget is at risk (by aggregating project budget with project health status).
- Measuring portfolio balance (spending levels by department, by strategic goal, by category, etc.)
- Measuring strategic health (by aggregating strategic alignment, project health, and budget)
- Risk-value bubble charts (by combing financial data with prioritization scoring data)
- Pareto charts (financial data by project and other categorical information)
- Tree maps (by combing financial data with prioritization scoring data and department)
Is Your Project List a Treasure Trove or Data Graveyard?
While working with a large client, one day I discovered that there was a wealth of data hiding in the project list that had never been analyzed. You may not realize it, but you could be sitting on a real treasure trove of data hiding in your project list that could drive new analytics and analysis about the portfolio. Here are six examples of portfolio analytic treasure waiting to be mined:

- Project completion rates: wouldn’t it be great to have some measurement of how many projects actually get completed? This is why you never want to delete projects from your list. When projects get cancelled, put on hold, or completed, be sure to capture this so you can analyze the data later. After a period of time, you can calculate your project success rate. Even better, you can calculate your success rate by project type, category, etc. This could help inform which types of projects are particularly risky or challenging.
- Project durations: for portfolio planning purposes you can calculate the average (and standard deviation) of the durations of your projects. This becomes very useful for initial project duration estimates, strategic planning, etc. When you combine this with other metadata such as project type, category, etc. you can better understand how long certain types of projects should take. For example, if the average duration of a highly complex type of project takes approximately 18 months, but a new proposed projects suggests that it can be done in 12 months, the governance team and portfolio manager can push back by asking “how will you complete this in 12 months if none of our teams have ever completed a project of this magnitude in that time frame?”
- Phase durations: if you have an existing Phase-Gate process, be sure to capture all the approval dates. For most Phase-Gate frameworks, a gate review marks the end of a phase. By calculating the days between gate reviews, you are actually capturing the duration of that particular phase. From there, by calculating the average duration by phase, you can do a better job of planning future gate reviews to keep projects on track. At one large company, this information was shared with the portfolio governance team, but they had no visibility to this problem and were surprised to learn that some projects languished for months in an early phase. After this, they began monitoring how long projects were in each phase of the project lifecycle. At the very least, knowing average phase durations can be used to facilitate better communication and project accountability.
- Average project costs: over time, governance teams should be getting better information about project costs. Calculating benchmarks for how much certain types of projects cost can inform whether a certain project investment is worth doing right now compared to the rest of the portfolio. Basic statistics (average with standard deviation) can be used to understand how much project costs are above or below the historical average. This information makes both the governance team and the overall portfolio management process smarter over time using real data.
- Average resource effort: if your organization captures resource effort for specific roles, you can also begin to understand the average resource utilization for project types and use this for portfolio planning purposes (which includes capacity planning).
- Average financial benefit: many companies do not consistently track financial benefits for their projects, but some do. If this information exists, then average financial benefit can also be calculated by project type to further inform portfolio planning. When combined with project durations, average costs, and resource effort, this becomes a very informative tool for strategic decision making. Projects with far higher than average cost/resource effort but below average financial benefit should be scrutinized further during gate reviews.
The Problem With Spreadsheets
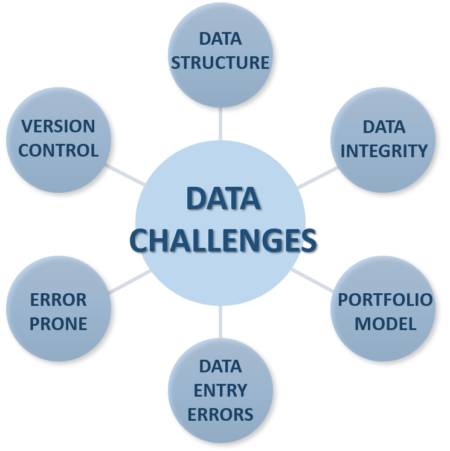
Most organizations start creating their project portfolio list using spreadsheets; this is understandable and logical. The problem is that organizations make one of two major mistakes – they purchase complex and expensive software that is hard to adopt or they stay on spreadsheets far too long. Organizations that rely on spreadsheets for tracking their project list end up with a large yet hidden productivity hit combined with delayed and weakened decision making. The underlying challenges with spreadsheets for managing the project list starts with data challenges:
- Data structure: most spreadsheet users do not adequately structure their project list data properly up front. After a short time, people lose the ability to create multiple views or to pivot the data properly. This impacts the ability to create timely and effective reports. Even if the data is structured well up front, there are still data integrity issues.
- Data integrity: data integrity is related to data quality but also refers to the accuracy, completeness, and consistency of data. When multiple users are in a spreadsheet and each enters data in their own way, it is easy for data quality to be compromised.
- Data entry errors: without adding layers of protection to a spreadsheet, it is easy for users to enter wrong data. Even worse, it is possible for users to delete or overwrite other user’s data.
- Spreadsheets are error prone: case studies have been written about the huge cost of spreadsheet errors. IBM referred to studies where 88% of all spreadsheets have at least one error. Raymond Panko from the University of Hawaii has done extensive research into this topic and highlights that spreadsheet error rates are comparable to software development error rates, except that software developers spend far more time with code quality and testing.
- Version control: most spreadsheet users still use desktop versions of spreadsheets. This means that it is possible for each user to save and maintain their own version of the spreadsheet which easily and quickly introduces the problem of having conflicting data or out-of-date versions. This is especially problematic at the portfolio level where senior leaders are making decisions based on out-of-date project lists.
- The portfolio model: portfolio management has multiple layers of data elements, but creating a portfolio model in spreadsheets can quickly get out of hand. It is far too easy to simply add a new column of data, but over time this causes the project list to become unwieldly and the project list succumbs to the problems listed above. It is not easy to capture all of the necessary project and portfolio data in a spreadsheet.
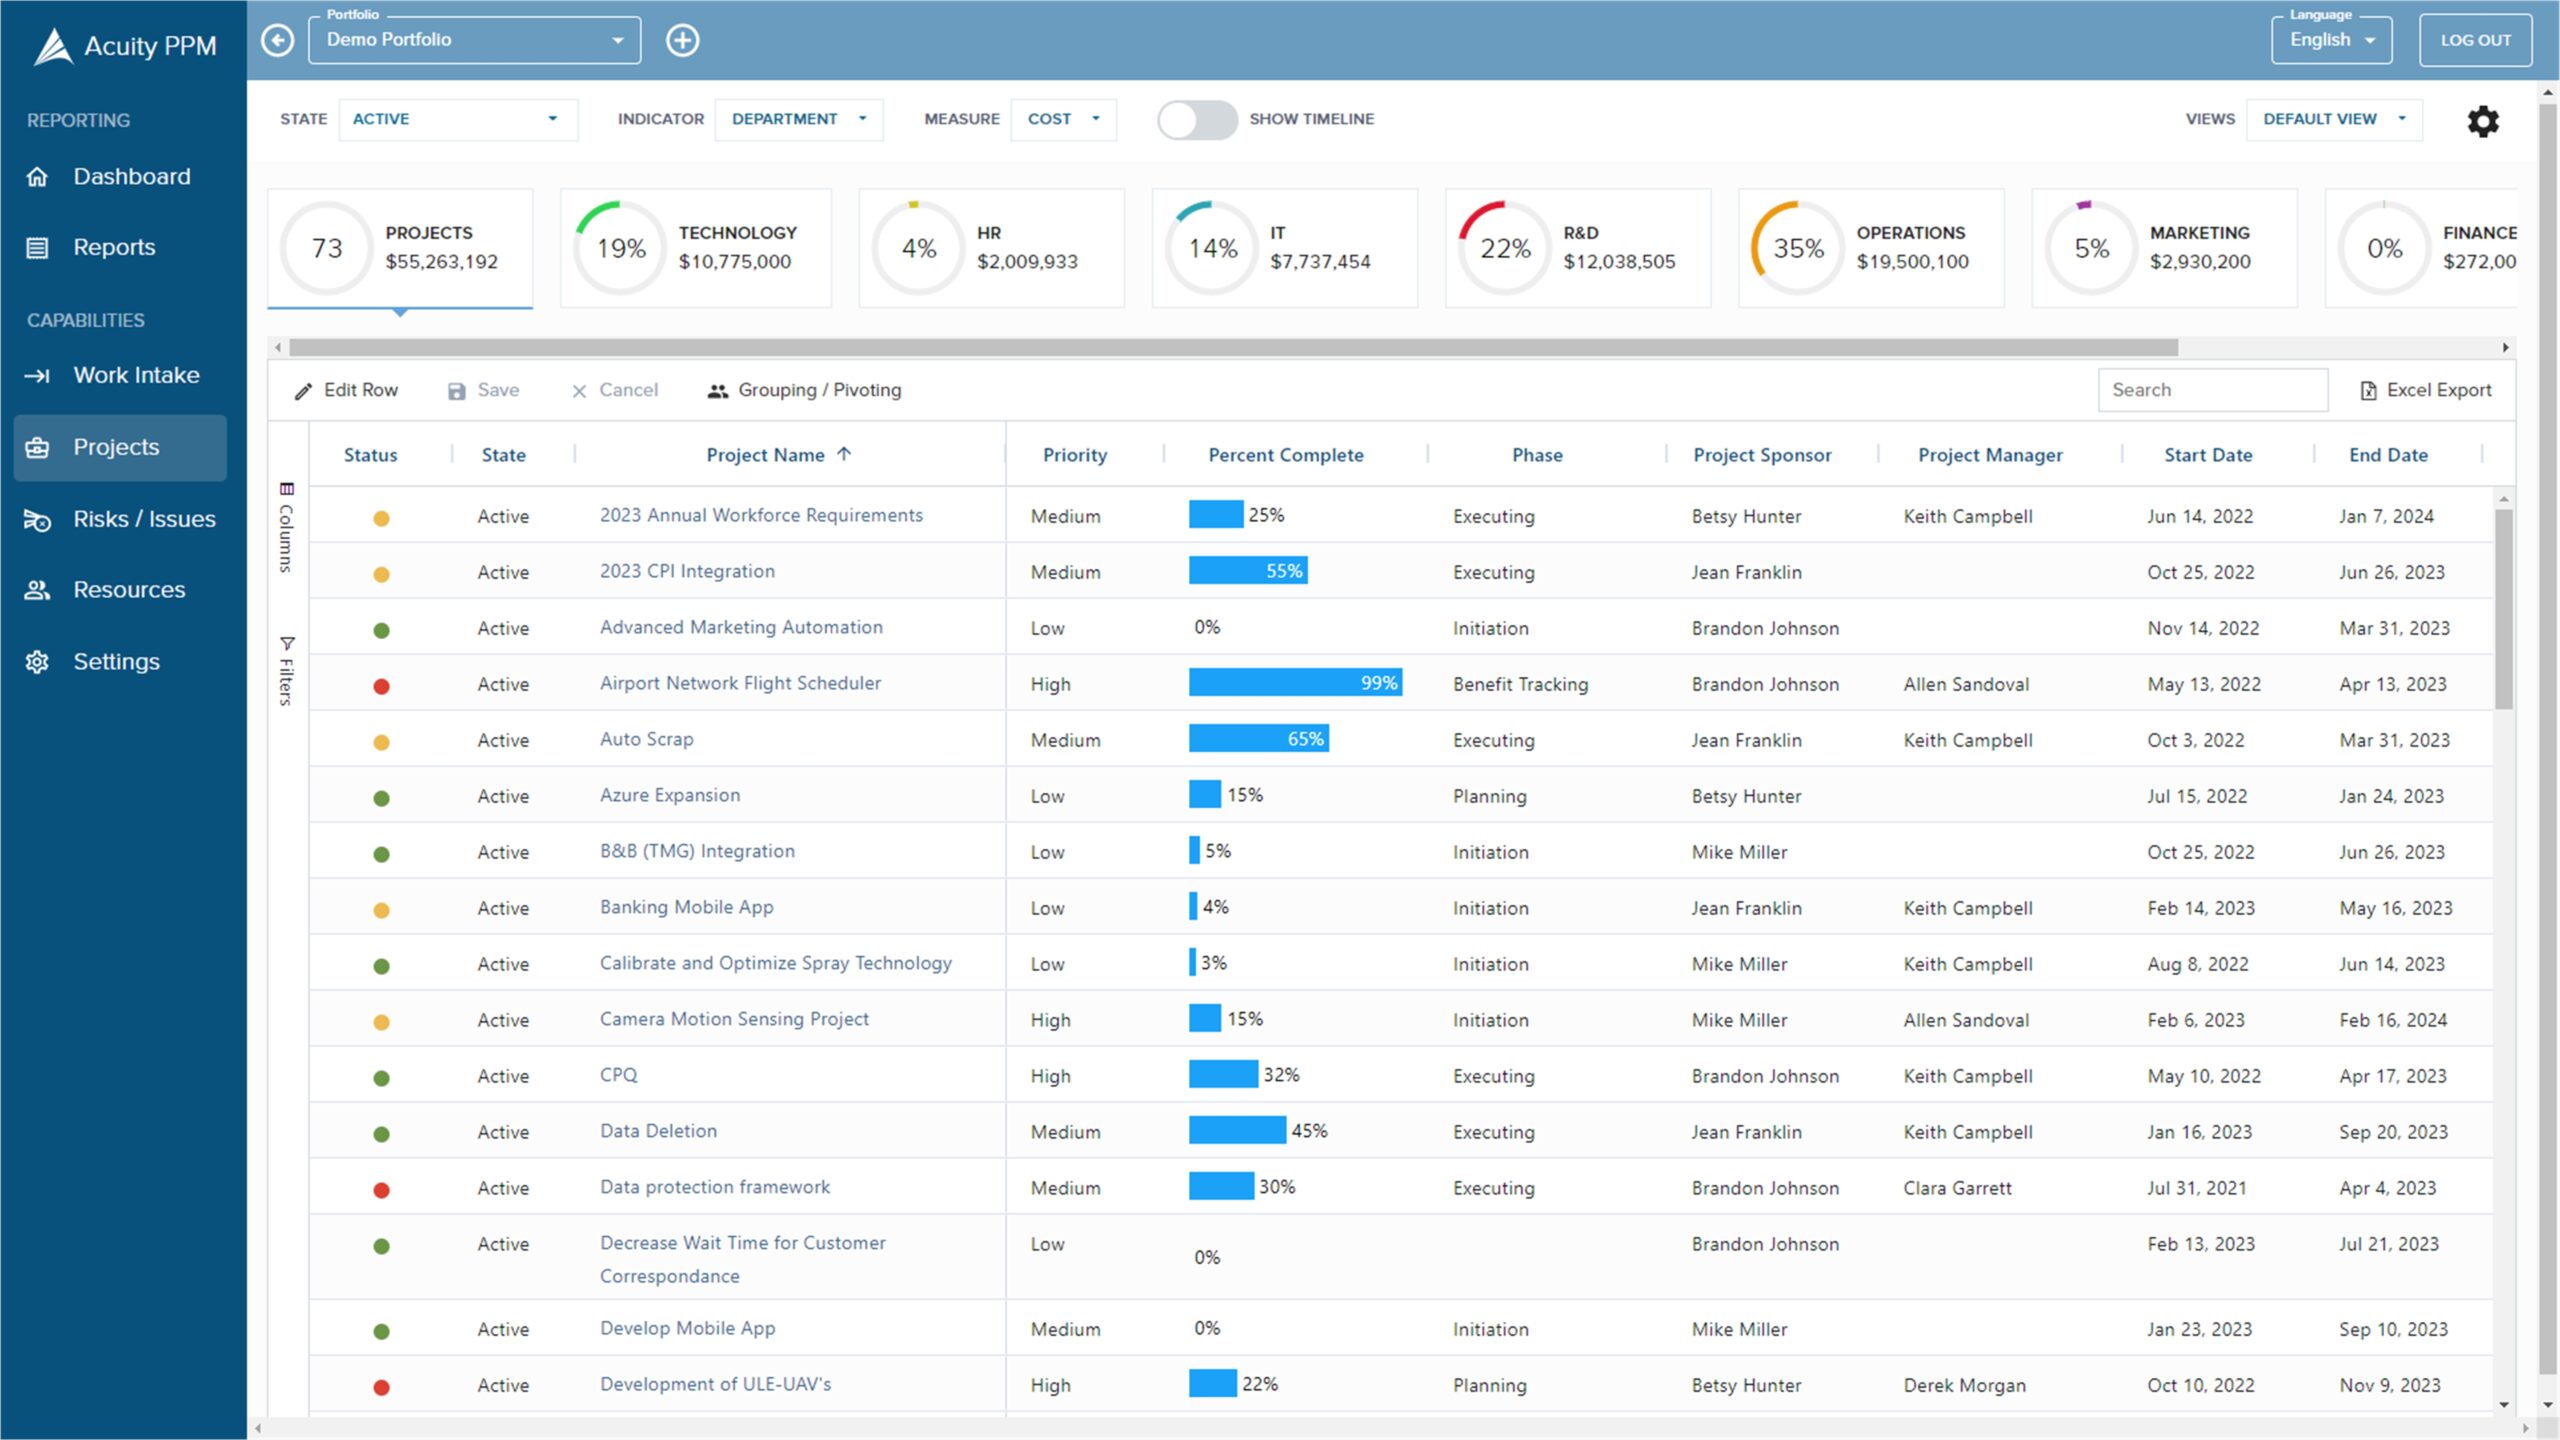
How Acuity PPM Software Can Help
For years, the #1 portfolio management tool has been spreadsheets. As an analysis tool, spreadsheets are great, but you should not rely on spreadsheets to maintain your project list. This is why Acuity PPM has taken a different approach and offers lightweight PPM software so that any PMO or project team can manage their project list in the cloud. Most project organizations are not be ready for complex portfolio management software, but that doesn’t mean you have to be stuck with spreadsheets forever. Acuity PPM gives you the option to manage your portfolio in the cloud with a user-friendly solution. Our PPM Starter module is the perfect alternative to managing your project list with spreadsheets. For more information, contact us.
Tim is a project and portfolio management consultant with over 15 years of experience working with the Fortune 500. He is an expert in maturity-based PPM and helps PMO Leaders build and improve their PMO to unlock more value for their company. He is one of the original PfMP’s (Portfolio Management Professionals) and a public speaker at business conferences and PMI events.
What is a project list?

A good project list is an important tool for managing the project portfolio as it contains fundamental information about all of your active, pending, completed, cancelled or postponed projects.
Why is a project list important?
A good project list is the single source of truth for project and portfolio data and will tell you what projects you are doing right now. The project list can produce project and portfolio reports and analytics and aids portfolio communication and facilitates discussion among teams and departments.
What common information is collected in a project list?
A good project list will capture the right information to help the organization manage the portfolio. Common data elements include: project title, project description, project state, current phase, project health, Project Manager, Project Sponsor, sponsoring department. project category, strategic alignment, start/finish dates, funding status, project costs, financial benefits, and priority scores.
What kind of reports can be generated from a project list?

There are several awesome portfolio reports you can generate from a great project list including: How much of the portfolio budget is at risk (by aggregating project budget with project health status), measuring portfolio balance (spending levels by department, by strategic goal, by category, etc.), measuring strategic health (by aggregating strategic alignment, project health, and budget), risk-value bubble charts (by combing financial data with prioritization scoring data), pareto charts (financial data by project and other categorical information), and tree maps (by combing financial data with prioritization scoring data and department).
Never miss an Acuity PPM article
Don't take our word, listen to what others are saying:
"I find value in all of your articles."
"Your articles are interesting and I am sharing them with my team who have limited project knowledge. They are very useful."